Case Studies And Screenshots
Scope
This file explains what the current screenshots and fixtures prove.
Important distinction: - the committed screenshots are simulator-generated unless stated otherwise - the committed replay fixtures are synthetic narrowband test captures - these assets prove reproducibility and pipeline behavior, not calibrated RF truth
UHD Live UI
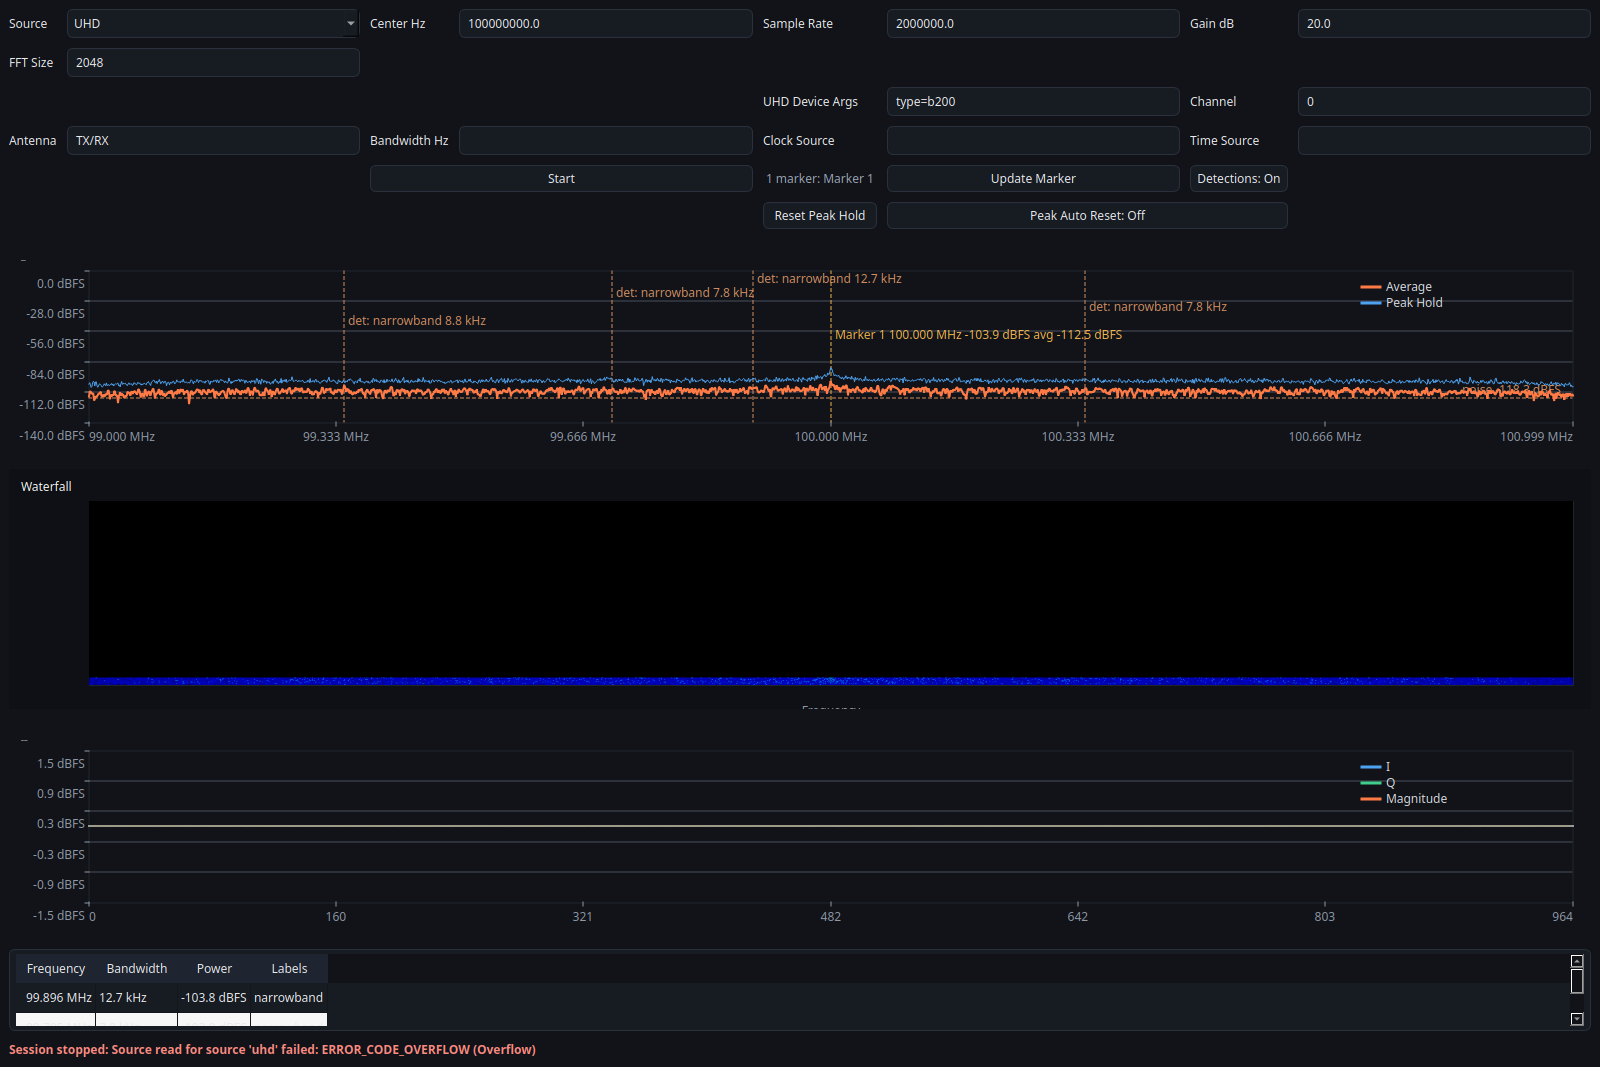
A hardware-backed GUI screenshot captured through the native UHD source path with an attached USRP.
What it proves: - the current GUI can run through the UHD code path rather than only the simulator path - the documentation now includes a screenshot from the actual live-device layout - the USRP-specific controls are visible in a realistic session configuration
Status:
- provenance: uhd live session
- evidence class: Illustrative for attached-hardware UI coverage
What it does not prove: - this single screenshot is not a full hardware validation report - it does not by itself prove long-run stability, calibration, or measurement accuracy
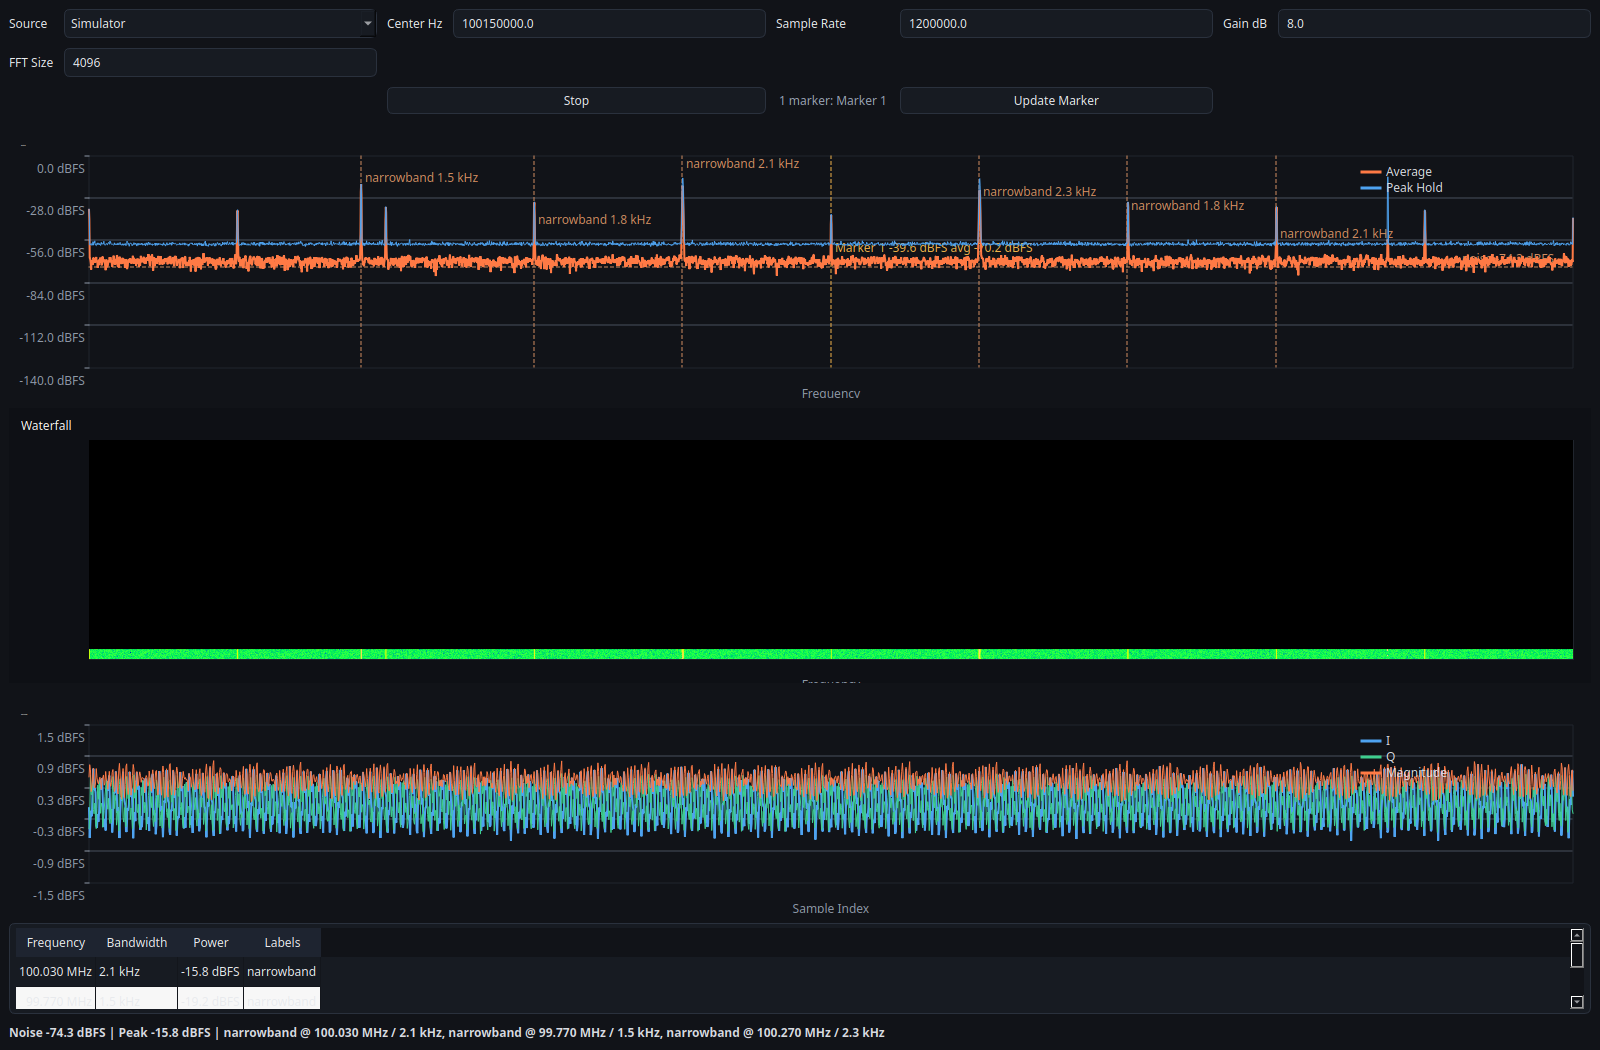
Overview UI
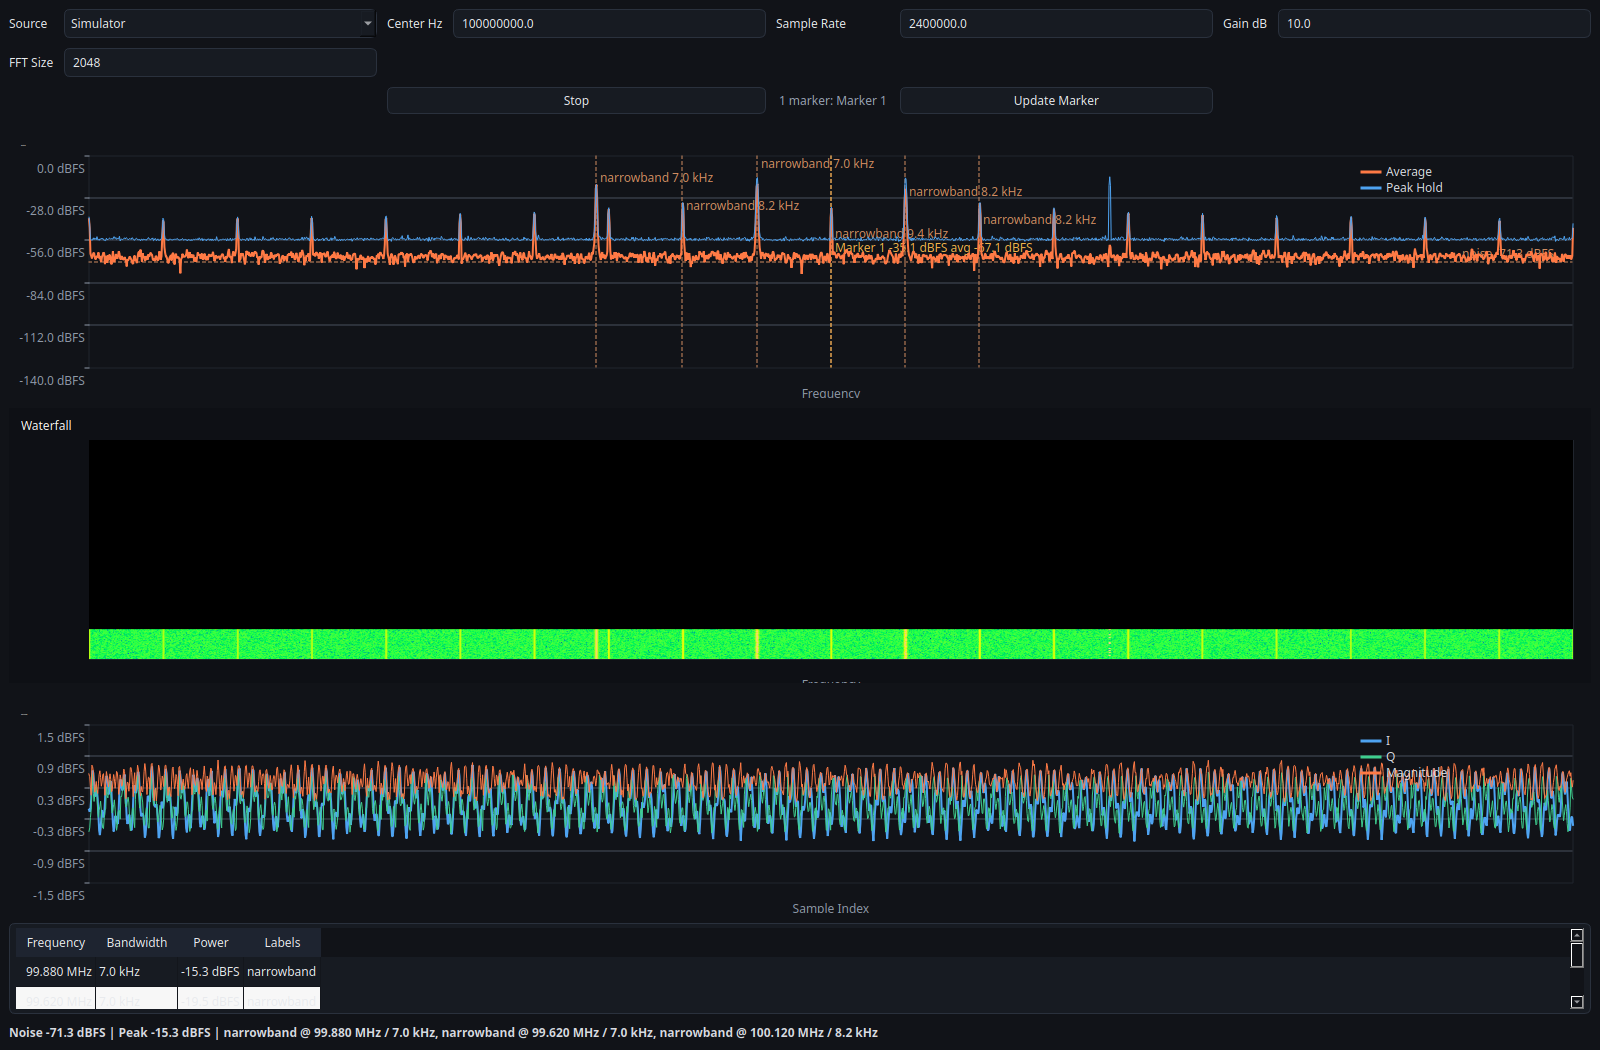
Full spectrum, waterfall, time-domain view, and detection table from the offscreen simulator GUI. This is a reproducible documentation asset, not live RF validation.
What it proves: - the GUI is fully driven by the backend snapshot API - the analyzer can display multiple signal-like structures simultaneously - the docs/screenshots are reproducible from code, not hand-edited assets - the same backend path can power both the GUI and the CLI
Status:
- provenance: simulator
- evidence class: Verified for GUI reproducibility
433 MHz Style Scene
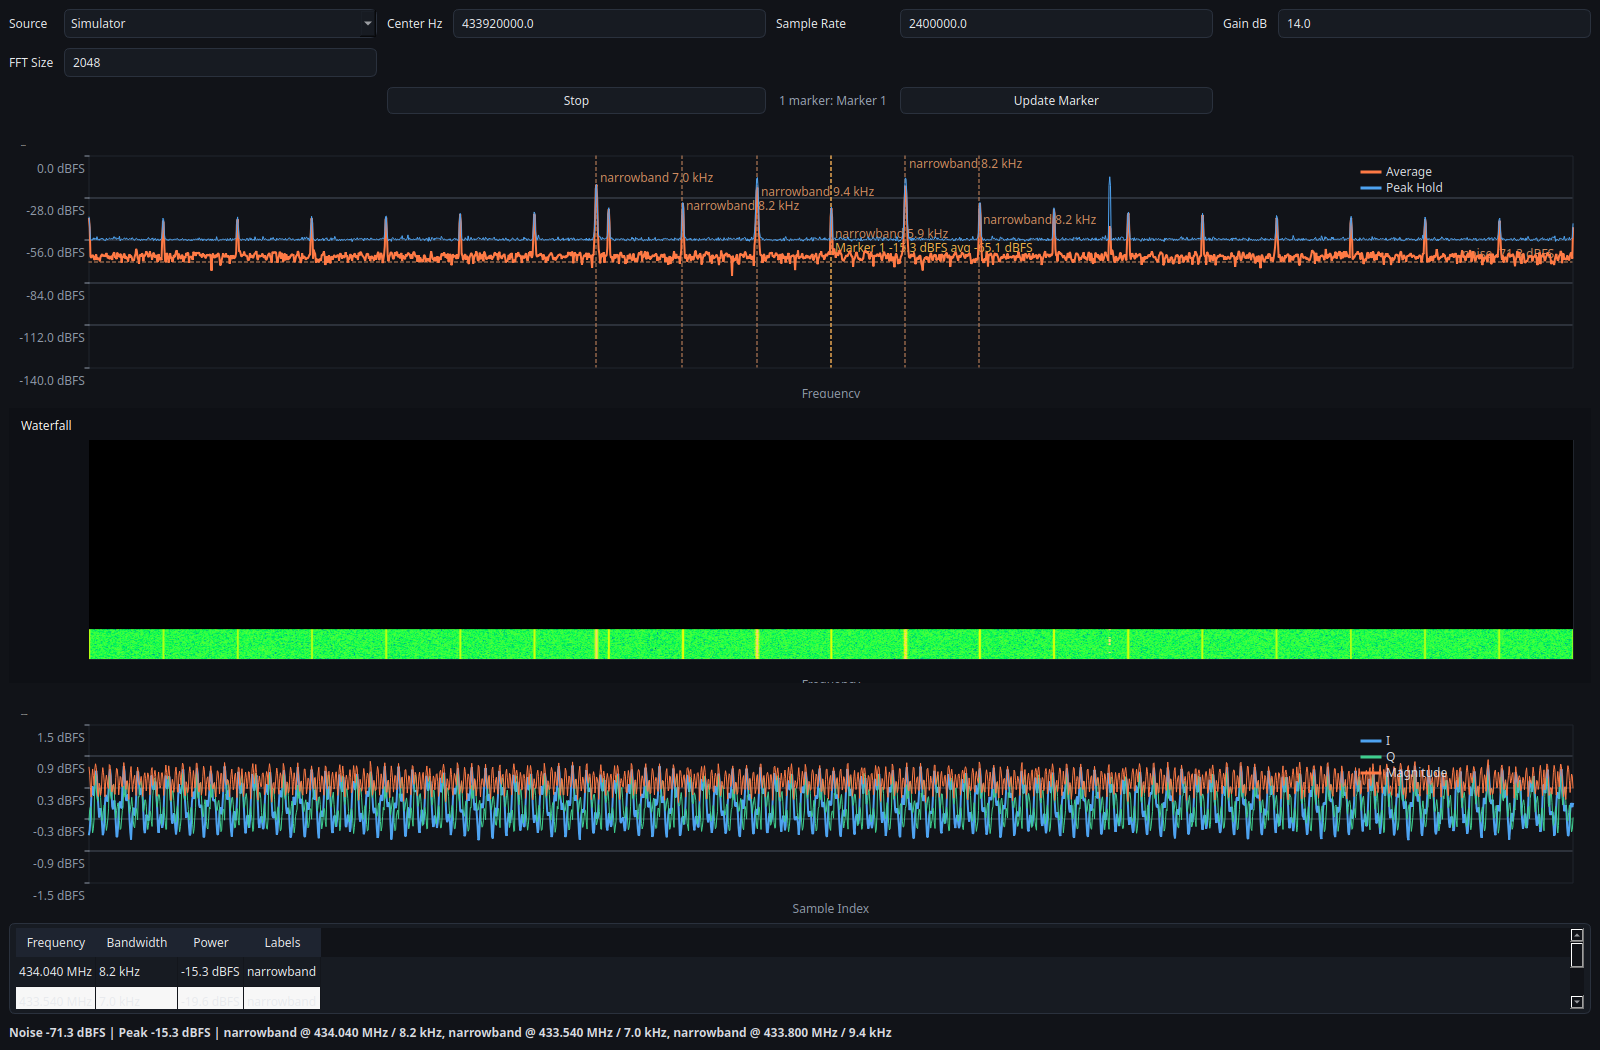
A simulator-backed scene centered around 433.92 MHz for portfolio and layout coverage. It is illustrative only and does not validate live RF conditions.
What it proves: - the UI handles alternate center frequencies and marker placement cleanly - the portfolio can present sub-GHz workflows in a reproducible way - the simulator path is useful for documentation and quick demos
Status:
- provenance: simulator
- evidence class: Verified for documentation reproducibility
What it does not prove: - this is not a real over-the-air ISM capture - this does not validate the analyzer against live RF conditions
Marker Editor
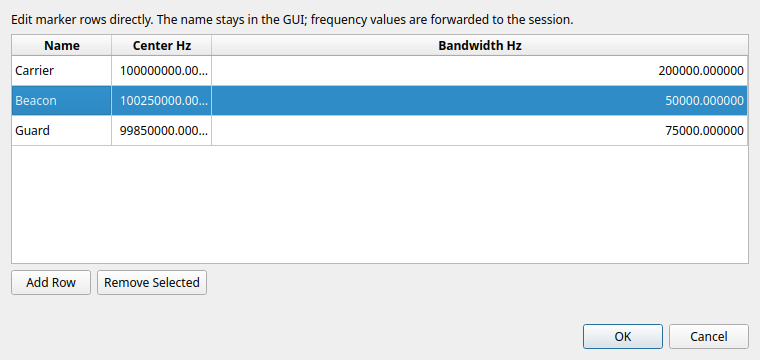
The table-based marker editor used to add, remove, and rename markers before applying them to the session.
What it proves: - the GUI can expose marker management in a dedicated modal dialog - marker names stay human-readable in the UI while the backend still receives the numeric marker spans - row-based editing is easier to document than the old inline fields
Status:
- provenance: simulator
- evidence class: Verified for GUI interaction coverage
Narrowband Fixture
A simulator-backed narrowband view used to show a tighter frequency span and marker measurement layout. It is reproducible and illustrative, not calibrated instrumentation.
Related fixtures:
- tests/fixtures/tone_cf32.bin
- tests/fixtures/tone_cf32.bin.json
- tests/fixtures/tone_cf32.sigmf-data
- tests/fixtures/tone_cf32.sigmf-meta
What it shows: - a deterministic narrowband tone around 100.15 MHz - replayable input suitable for regression tests
What it proves: - replay analysis is deterministic - raw and SigMF paths both support the same basic narrowband example - bandwidth estimation and marker measurement can be validated against a known synthetic signal, within the limits described in the trust page - CLI replay prints repeatable detections for the same capture
Status:
- provenance: replay fixture
- evidence class: Verified for deterministic replay behavior
CLI Replay Example
Input data:
- tests/fixtures/tone_cf32.sigmf-data
- tests/fixtures/tone_cf32.sigmf-meta
Command:
./build/sdr-analyzer-cli --source replay --input tests/fixtures/tone_cf32.sigmf-data --meta tests/fixtures/tone_cf32.sigmf-meta --frames 4
Expected output:
- frame lines with noise= and detections=
- detections near 100.15 MHz
Interpretation: - this is a deterministic replay proof, not a live-spectrum calibration
Log Measurements Over Time
The CLI can export the same structured measurement schema that Python can build from the public API:
./build/sdr-analyzer-cli \
  --source simulator \
  --frames 20 \
  --export-jsonl docs/examples/measurements.jsonl \
  --export-interval 2
Use this when you want: - a metadata/header record for reproducibility - frame-local detections and marker measurements logged over time - a JSONL file that downstream Python tooling can read directly
Interpretation: - marker measurements remain frame-local values, not long-window calibrated averages - the export is for analysis and reproducibility, not calibrated instrumentation
Regenerating Screenshots
Build the native and Python GUI pieces first, then render each named simulator preset in offscreen mode.
cmake -S . -B build
cmake --build build
QT_QPA_PLATFORM=offscreen PYTHONPATH=python python scripts/generate_portfolio_assets.py \
  --preset overview \
  --output docs/screenshots/overview.png
QT_QPA_PLATFORM=offscreen PYTHONPATH=python python scripts/generate_portfolio_assets.py \
  --preset 433-mhz \
  --output docs/screenshots/ism_433.png
QT_QPA_PLATFORM=offscreen PYTHONPATH=python python scripts/generate_portfolio_assets.py \
  --preset narrowband-focus \
  --output docs/screenshots/narrowband_focus.png
QT_QPA_PLATFORM=offscreen PYTHONPATH=python python scripts/generate_portfolio_assets.py \
  --preset uhd-overview \
  --output docs/screenshots/uhd_overview.png
Use --all --output-dir docs/screenshots if you want to refresh the full committed set in one pass.
The marker editor screenshot is captured directly from the dialog widget and should be regenerated with a small offscreen helper when the table layout changes.
The UHD screenshot depends on attached hardware and is intentionally not part of --all.
What Still Improves The Portfolio
The next step up from the current docs set is real capture evidence: - FM broadcast recording with replay and expected bandwidth notes - real 433 MHz activity capture - one or more actual hardware screenshots from RTL-SDR and USRP sessions
Those future assets should only be added together with: - a completed hardware validation report - saved diagnostics logs - saved JSONL measurement export when relevant - exact environment metadata